Showing posts with label Hockey. Show all posts

Friday, June 19, 2015

Top 10 (Realistic) Cam Talbot Trades

    The following are workshopped trade proposals regarding the recent Cam Talbot trade rumors, including the Edmonton Oilers, San Jose Sharks & Buffalo Sabres. Since we published this historical data on the historic trade value of draft picks a few days ago, I thought we’d try to carve out some realistic and precise trades that could feasibly happen.


   When comparing Talbot’s speculative future to that of what happened with Cory Schneider in 2013... it's important to be able to take the comparison with the appropriate grain of salt. Let’s compare the two trade-bait goaltenders:


   No, the New York Rangers are not in a position to demand a #9 overall pick straight-up for their goaltender, as the Canucks were able to reap off Schneider. But… Talbot’s stats, while of less sample size and quality, remain damn good. So there’s obvious merit to the list of suitors interested in acquiring his services.

  1. This is the 1st trade example idea we’ll submit for examination. Here, this really only makes sense if our trade partner (BUF, EDM or SJ) is trading for Cam Talbot under the assumption that Talbot is equivalent to a late 1st-Round draft pick.

or...


or...


Historical reference
On June 25, 2010… #22 & #113 traded for #27 & #57.

     2.  Again, we assume that teams are pursuing Talbot in a trade, and are still willing to treat him like a late 1st-Round draft pick in terms of absolute trade value:


  Essentially we have New York having its 2nd, 3rd & 4th Rounders being upgraded at Edmonton’s expense. The Rangers’ 2nd-Rounder moves up 2 pegs, their 3rd-Rounder moves up 10 pegs, & their 4th-Rounder moves up 2 pegs. But on the other hand, Edmonton believes it is upgrading it’s #33 overall, since Talbot is comparatively 3 to 8 pegs higher than a late 1st-Rounder.

or...


   While certainly more elaborate, it holds the same principal as the previous Edmonton trade example. If Talbot is treated by Buffalo as better than a #31 overall pick… this trade has the Rangers upgrade 1st, 2nd & 7th Rounders while Buffalo upgrades its 3rd & 4th. Once again, this only computes if Buffalo deems Talbot the equivalent of a late-1st-Rounder.

   3. Now we’ll begin to decrease Talbot’s perceived trade value. We’ll now say the market will trade where Talbot is treated as that of a #30, #31, #32, #33, #34 or #35 overall draft pick. The obvious suggestions (and frankly most realistic, in my opinion) now become:


or...


or...


Historical reference
On June 25, 2010… #30 traded for #35& #58.

   4. Yet if Talbot’s perceived value is even slightly lower than what we’ve been discussing… as in Talbot being treated more like a 2nd-Rounder in the late 30s or early 40s overall? Then rather than Talbot being an upgrade to their #33 overall, Edmonton begins to see at as a downgrade! This is also around the point where San Jose’s 2nd-Rounder can become a straight-up swap. In which case, something like one of these becomes more likely: 


or...


Historical reference
On June 21, 2008… #38 traded for #46 & #76.

Conclusion

   - We know the Oilers, Sharks & Sabres have expressed interest in Talbot
   - We know the Rangers likely have more to gain from Talbot than retaining him, as renewing his contract past 2016 seems unlikely at this point in time
   - We know the Rangers could include a body with Talbot in an effort to relieve NYR payroll for next season...
   - ...but we also know the Rangers could also trade Talbot in an effort to restore 2015 draft picks to the team, which has depleted its 2015 & 2016 draft picks en route to going "all in" on shopping upgrades such as Keith Yandle & Martin St. Louis.
   - The only "unknown" we deal with is how much these other teams are willing to give up. How much do they believe Talbot can be a cornerstone netminder? How much do they believe a long-term extension can be hashed out upon acquiring Cam? How much is a team willing to invest this summer for Talbot's future?

   These hypothetically brainstormed trades seem realistic. We can only wait and see what ultimately results in these bidding bubbles between now and the last weekend in June.

Monday, June 15, 2015

Does Henrik Lundqvist's Contract HURT or HELP the NY Rangers?


   There's some debate that Henrik Lundqvist's league-leading salary of $8.5 million per year is too much. More specifically, some Rangers fans feel it hurts the team's chances at a Stanley Cup since all that money is not allocated towards forwards nor defensemen. So with the 2014-15 NHL regular season statistics locked in the books from now to eternity, I thought I'd spend this summer day snooping around this theory. Here we go...

   First I took all goaltenders who faced a minimum of 328 shots in the regular season (or faced a minimum of 4 shots on goal per team game during the season). This narrowed the field to 61 NHL goalies from which to extrapolate our data. Then I looked at their total Goals Saved Above Replacement, a nifty stat meant to compare a goaltender to the theoretical average goalie in the given season. I also jotted down their time on ice (rounded to the nearest minute) & 2014-15 salary cap (Average Annual Value).

   Here's the spreadsheet in case anyone would like to check my work.

   When tabulating the averages of this data, we arrived at:

   - The average NHL goalie stopped 1.037377 Goals Above Average in 2014-15
   - The average NHL goalie played 2,267 minutes in 2014-15
   - The average NHL goalie had a cap hit of $3,011,066 in 2014-15

   Taking these three findings into account, we can bundle them into a single, concise "going rate" of the average NHL goalie in 2014-15:

   - The typical NHL goalie stopped 0.027525 Goals Above Average per 60 minutes, paid at a $3,011,066 cap hit

   So...

   How does King Henrik compare relative to that clearinghouse rate?

   - Lundqvist stopped 10.43 Goals Above Average in 2014-15
   - Lundqvist played 2,743 minutes in 2014-15
   - Lundqvist had a cap hit of $8,500,000 in 2014-15

   Therefore...

   - Lundqvist stopped 0.228144 Goals Above Average per 60 minutes, paid at a $8,500,000 cap hit

   How does Lundqvist directly contrast against our mean findings?

   - Lundqvist's GSAA/hour rate was 8.29 times the NHL's average goalie rate
   - Lundqvist's salary cap hit was 2.82 times the NHL's average goalie cap hit

   In essence, Lundqvist performed over 8.3 times the market rate for only 2.8 times the price!

   If you go to a supermarket to purchase frozen TV dinners... but they have a special offering 8.3 times the amount you intended to get, but for less than triple the price you were expecting to pay... kinda hard to categorize that as anything but a good deal.

   Why did I make frozen TV dinners the example? Because a frozen meal purchased today will likely expire right around the time Lundqvist's play will [historically] decline. Do we see Lundqvist becoming anything less than an above-average goalie at any point in the next few years? It seems highly unlikely, barring a massive injury and/or drop-off. While year-to-year subtle regression is the historical norm, HockeyGraphs analysis suggest at least 3 years before major regression.


   So even with his league-leading super-hefty cap hit, Lundqvist was still an absolute bargain in the 2014-15 season, the 1st year of his 6-year contract.

   Let's look at a few graphs to evaluate Lundqvist's legitimacy as a top-paid netminder in the post-post-salary-cap era:


   - Lundqvist has had 10 consecutive seasons of either accumulating 30 wins and/or leading the NHL in wins during a shortened season.
   - Lundqvist, compared to the top dogs of the past decade, has yet to have a below-average season.
    - Lundqvist's first 9 years saw him win the Vezina once (2012), where he received 80% of the votes, smashing the record for most-lopsided Vezina voting result since votes were made public in 1981-82.
   - Though his streak may very well end in a few weeks, Lundqvist has gone 9 consecutive seasons while placing no worse than 6th in yearly Vezina votes. In other words, there has yet to be a season where Lundqvist was not voted one of the Top-6 NHL goalies by the league's general managers
   - Lundqvist has never gone a season without receiving votes for at least 1 NHL trophy.


   Lundqvist's contribution to the NY Rangers last multi-round playoff runs the past 4 seasons undoubtedly suggest value, even at the steepest price in the land:


   So, while Lundqvist's heavy cap hit will ultimately depreciate in terms of bang-for-buck, as he is contracted until his late 30's... it is not a liability yet. In fact the numbers suggest that it unbelievably remains a bargain, at least in this point in time. In fact, until we see significant regression, there is no way someone can honestly claim Lundqvist (or his plump contract) has actually hurt the Rangers' chances at winning it all.
   Recent goalies to remain extremely productive and valuable to their team, even north of their 35th birthdays, include...

   Tim Thomas

Dominik Hasek

Patrick Roy

   Has Lundqvist not earned the right to be compared to Thomas, Hasek or Roy? While all these players went on to win a Cup (which Lundqvist obviously hasn't...yet?)... he is inarguably one of, if not the, best goalie of his era. 

   Thomas & Hasek also poke holes in the theory "If Lundqvist hasn't won a Cup by now, he never will!" That contention, plus the absolute myth that Lundqvist himself has cost the Rangers a Cup, is irrefutably flawed. Who can genuinely believe it was Lundqvist's contract which cost the Rangers the 2015 postseason, instead of, oh I don't know... The injuries to Mats ZuccarelloRyan McDonagh, Dan Girardi, Keith Yandle, & Jesper Fast? 

   If 10 consecutive coinflips are all heads, how logical is it to conclude "since there hasn't been any tails before, their never will be in the future!"

   ... That logic simply doesn't hold water.

   Speaking of injuries... other than a few weeks in 2006, a few games in 2013, and the freak vascular injury suffered last February... Lundqvist's healthiness in his career has been absolutely remarkable. No torn ligaments, no broken bones, no concussions, no major or relevant surgery... in a decade! His high-quality production aside, surely his abnormally high attendance in regular season & playoff games also validate his contractual worth.

   Quality, quantity, relativity... they all point towards Lundqvist being a resounding "positive" on the New York roster.


   We'll be posting more goaltender analytical evaluations throughout the summer, including league-wide goaltender stats we've personally created here at SatherOnWaivers. Follow us on Twitter (@HockeyStatMiner ) to receive further updates, and feel free to leave feedback as well.

   All hail the [now economically validated] King!


Sunday, April 5, 2015

J.T. Miller's Rising [Price Tag]

   J.T. Miller played in 15 games during all of October, November & December earlier this season. After failing to outclass fellow Blueshirt bluechips Kevin Hayes & Anthony Duclair for 3rd line forwardship in the 1st half of the season... Miller has recently resurged his priority in the NY Rangers regular lineup. In fact, Miller played in 15 games during the month of March alone!


   Earlier in the season, it seemed Miller's cost of a new contract this summer would not be much higher than his $777,000 qualifying offer. In fact as little as a few months ago, there was no reason to think Miller would receive anything outside the $800,000-900,000 range on a 1-or-2-year deal. But with Miller suddenly becoming a relevant contributor to the Metropolitan Division champions (including a game-winning-assist & game-winning-goal vs. Winnipeg & Minnesota last week)... the question is now blooming: how much will J.T. Miller cost to keep this summer?

   Since he is coming off of his entry-level contract, Miller does not have arbitration rights. Glen Sather has historically signed young forwards in this scenario to two-year 'bridge' contracts. So, in the interest of getting a feel for Miller's possible costs, I assembled 5 players whom could be noted as 'comparable.'


   These 5 players all:

   - Are players signed to a 2-year bridge deal following their entry-level-contract
   - All in their early 20's
   - All, like Miller, had no right to salary arbitration when signing their new contract

   Let's look at the data:

   Miller has less years of age, career games, & career points-per-game than the average. Miller's pedigree is the only above-average characteristic.

   So: is a 2-year $1.7 million/year contract something J.T. Miller can realistically be offered? Sather has a propensity to lowball his helpless restricted free agents... What would Miller be worth on a 1-year deal? $1.5 million?

   The playoffs can make-or-break these numbers. Is it inconceivable for every postseason game-winning-goal scored by Miller to equate to a $25,000 increase to the figures we are currently discussing?

   If the chart is any indicator... then 2.45% of the current $69 million salary cap would be $1.69 million/year.

   Stay tuned...


Friday, April 3, 2015

Alain Vigneault: The Road Warrior


   On Thursday night, Alain Vigneault broke his own NY Rangers record by setting the 89-year-old NHL franchise record for road wins in a single season (26), breaking his own record from last season (25). It should come to little surprise, as A.V.'s marriage in New York City is as strong and successfully vibrant than at any point before. Oh, and by the way, the NY Rangers still have 2 road games remaining this season, should A.V. want to set the bar even higher for 2015-16.


   The NY Rangers round out the regular season (after also having clinched the Metro Division last night as well) with road games in New Jersey [4/7] & Washington [4/11]. Should NY win both, the 2013/14 & 14/15 would be tied for the highest-winning-percentage NHL road team over a 2-year span since the 2005 lockout.


  I mean... is there any way Rangers fans COULDN'T be in love with this guy?


https://www.youtube.com/watch?v=FIehnX-OibA

Thursday, March 12, 2015

NY Rangers Continue Elite Hockey, Kevin Klein Gets X-Rayed

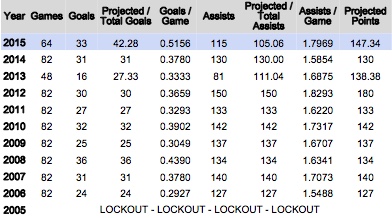
   Following the NY Rangers defeat of division rival Washington Capitals last night, the NY Rangers have moved into #1 in the NHL (with games at hand over everyone, mind you), causing the NYR fan online-community to drop some pretty absurd statistics in the hours following the game. Here are a few...

PROJECTED NHL STANDINGS POINTS OVER 82-GAMES:
via HockeyRodent.com


   But on a less joyful subject...

   In the final minute of the New York Rangers' 3-1 defeat of the Washington Capitals, Kevin Klein took a puck to the arm/shoulder and painfully made his way off the ice. Andrew Gross reported Klein, sporting bandages over his arm, when asked "Are you OK?', told reporters "No, not really." K.K. will have X-Rays taken, which is certainly not a good sign for Rangers fans. We here at SatherOnWaivers don't have any additional information to add to this story, but we can offer some analysis into the worst-case scenario:

   In January 2013, Joffrey Lupul took a puck to the arm (video HERE), and ended up missing the next 52 days nursing a broken arm. If, hypothetically, Klein did suffer a broken bone last night, and such a timetable of recovery was given here: Klein would theoretically return the 1st week of May, likely the 2nd round of NHL playoffs. 

   While both Lupul & Klein's injuries appear similar to one another, it's not yet known whether or not the diagnosis will be comparable at all. In the mean time, Matt Hunwick, Chris Summers & Mike Kostka are the "spare" defensemen the NY Rangers have available in the event Klein misses serious time.

   Editor's Note:

   Sounds as if Kevin Klein will miss time, likely a broken arm, could be 4-6 weeks. NHL Playoffs begin in 5.


Monday, March 9, 2015

Examining The 2015 NY Rangers Blueline

Is this the best offensive defense that Glen Sather has Ever Assembled?

  At 17:02 in the first period, Dan Girardi picked up his 3rd goal of the season against a very good Detroit Red Wing penalty kill.  On its’ own, this isn’t article-worthy news.  Girardi’s points-per-game numbers look ordinary to those of his career, as do Ryan McDonagh’s and Marc Staal’s.  

  But at 17:02, Girardi scored the 33rd goal for a Ranger defenseman this season.  The last time that the Blueshirt rearguard had that many in the regular season was the 2007-08 season (36 that year, 13 on the power play).  

  Perhaps some rephrasing would clear things up: The NY Rangers defense is on pace to score 42 goals...

  ...Notwithstanding the fact that Keith Yandle has yet to pick up a point as a Ranger.

  Let’s take a look at all of the Rangers defensive production since the 2005 NHL Lockout - We know Glen Sather has been GM since 2000, but comparing the NHL before and after the introduction of the two-line pass can get complicated.  We’ll keep it to when the Rangers were playoff-competitive under Sather, so 2005-2015.

NYR Defensive Scoring 2006-2015


Two quick points:

  1. Prior to Yandle, John Moore and Matt Hunwick had split the majority of the the season rotating in the 6th and final defensive roster spot (In fact: both were used to rearguard the 3rd pair for most the top-4’s 29 collective games injured this year). They collectively had 1 goal in 78 games before the addition of Yandle ended the John Moore experiment.  
  2. The 2011-12 Broadway blueline patrol that surprisingly picked up 180 points (30-150) in the regular season was led by the remarkably unremarkable Michael Del Zotto.  He would only last one more full, albeit lockout-shortened season before packing for Nashville in one of Sather’s slickest moves, the straight-up swap for Kevin Klein.

  The emergence of Klein has given the Rangers a journeyman who can move around the line-up, and who seems to have a knack for the big-goals lately.  The unfortunately bloated contract of Dan Boyle shouldn’t overshadow his serviceable stats - 20:03 per game, +14, 8 goals and 7 assists in only 47 games.  

  Yandle is the wildcard in this analysis.  It’s been 3 games, and all he has to show for his efforts is a -1 and 7 shots on goal.  Not terrible for a guy who has adjust to a winning mentality after 9 seasons with a struggling franchise consistently on the brink of relocating (we’d love an Anthony Duclair Seattle jersey, but that’s just us).  But the potential is insane.  On any given night, he could be the best Rangers defenseman on the team, and did we mention his cap hit is only $2.625M this year and the next?  We’ll gloss over the loss of top prospect Duclair and yet another 1st round draft pick, but can you blame us?  The Rangers “only” need to win 11 of their 18 remaining regular-season games to match their 51 win total from 2011-12.

  Need we point out NYR are 2-0-1 in the James Sheppard Keith Yandle Era? How distant the rapture of Wade Redden seems to be.

  But we have to give it up to Sather here.  Each one of the Rangers’ top six defensemen have a different background that brought them to the team:

  • Ryan McDonagh was an elite NCAA defenseman acquired in the steal of the century, eventually becoming NYR Captain.
  • Dan Girardi, originally undrafted, fought through the ranks of the ECHL & AHL to ultimately embody the 1st-pair right-hand patrol.
  • Marc Staal, 1st round pick, wasn’t even supposed to make the team in the 2007 NYR training camp, yet secured his roster position and never looked back.
  • Dan Boyle, the eldest defensive veteran, literally took an open-market paycut to come to this Cup contender last July.
  • Yandle (and Klein last year) have been important trade returns hoping to complement the present window of contention, not-so-coincidentally amplified since Alain Vigneault was hired as Head Coach.

  The current 2014-15 NY Rangers also have our vote for the strongest six ever assembled in New York by Glen Sather. And no, Don Cherry, it’s not because they’re all North American, that’s just a coincidence. The current crop of Rangers defensemen are as legitimate as a Top-6 can be in today’s NHL, and deserve all the praise and admiration they’ve collectively received, including this very article, for whatever that’s worth.

Sunday, March 8, 2015

Talbot vs Lundqvist? Introducing "The Ludas Rating", a BRAND NEW goaltending stat!

   Is it a bigger accomplishment to receive a (C+) in a very, very difficult class in school... or receive an (A-) in a trivially easier one? 

   In an effort to run some numbers on NYR goaltenders Henrik Lundqvist & Cam Talbot, we here at SatherOnWaivers have accidentally stumbled upon a whole new method of analyzing & evaluating an NHL goaltender’s performance in a season. Initially we wanted to judge Talbot’s performance in net this season versus Lundqvist, particularly this season since filling in full-time for Lundqvist since his injury. So here’s what we did:

  • We went through each net minder’s seasonal game log, and noted the amount of ice time each goaltender logged against each NHL team.
  • Then, we calculated each goalie's respective opponent’s # of NHL standings points, weighted in average of each goalie's specific icetimes against each opponent
  • In the name of relativity and perspective, we also found the same data for both goalies in the 2013-14 NHL season as well
  • Finally, we procured a weighted average of how many standings points in an opponent each goalie was facing in the average-60 minute game.

   Still confused?

   Let’s say it’s the 2013-14 NHL Season, we want to compare a few goalies, and the NHL league-wide average standings points per team was 92.233. Goalie A played 60 minutes against the Buffalo Sabres, who were the worst team in the NHL (52 points). Let’s say in those 60 minutes, Goalie A had a GSAA of 3.00, meaning he theoretically stopped 3 more goals than the baseline-average NHL goalie would have stopped himself. Now Goalie B, on the other hand, also played 60 minutes that season, except played the Anaheim Ducks, who were the #1 team in the West (116 points). Yet in that game, Goalie B had a GSAA of 1.50.

   Goalie A stopped 3 goals-above-average against a terrible team, while Goalie B stopped 1.5 goals-above-average against an elite team. So which performance was empirically better?

   That was what we were trying to offer a remedy to, but instead created a brand new goaltending analytic: The Ludas Rating. The Ludas Rating offers itself as a measure of inflation/deflation for performance numbers, taking into account what quality of opponent those numbers were generated from in the first place. 

   In other words, the Ludas Rating attempts to tackle  “how many standings points was Hank or Cam facing in the average game? … And even then, how does one compare different performances against varying quality of opponent?”

   To solve this example...

   Goalie A: 
  • 3.0 GSAA in 60 minutes
  • Average NHL Standings points of Average Competition: 52
  • Average NHL Standings points per NHL team: 92.233

52 / 92.233 = 0.5638

3.00 x 0.5638 = 1.691

1.691 “adjusted" GSAA per hour, or a “Ludas Rating” of 1.691

   Goalie B:
  • 1.5 GSAA in 60 minutes
  • Average NHL standings points of Average Competition: 116
  • Average NHL Standings points per NHL team: 92.233

116/92.233 = 1.2577

1.50 x 1.2577 = 1.8865

1.8865 “adjusted” GSAA per hour, or a “Ludas Rating of 1.8865

   … So it would seem Goalie B has a higher/better Ludas Rating, as his traditional numbers were not as good as those of Goalie A, but his quality of competition was much higher, thus making his 1.5 GSAA/hr vs ANH adjustably better than the 3.00 GSAA/hr vs BUF. 

   So now that we’ve explained what the Ludas Rating is, let’s return to the original subjects of Cam Talbot & Henrik Lundqvist. Here’s their relative stats from last year, the 2013-14 NHL season:


   And just like the introductory example into the Ludas Rating, we see Talbot’s .7558 GSAA/hr seems vastly superior to Lundqvist’s .1963. But, taking into account Talbot was playing weaker competition (83.536 standings points/opponent) than Lundqvist (91.716 standings points/opponent), the Ludas Rating adjusts Talbot’s GSAA/hr to be a lower rate. While Lundqvist technically has his lowered too (playing opponents less than 1% below-average), not nearly as much as Talbot’s. 

   Like other analytical metrics into interpreting data, the Ludas Rating is not perfect. A franchise playing against Lundqvist in October may be a very different team than the NHL Standings will reflect 6 months later. Goalies must face 328 shots in an 82-game season to qualify, as their GSAA is not tabulated under a lesser sample size. This is a quality-of-competition adjustor for GSAA-per-hour, using relative NHL Standings Points as a measuring stick to judge opposition’s “quality.” 

   So what about their Ludas Ratings in the current 2014-15 NHL season?

   *Since the season is ongoing, and teams have not completed all their games, the metric of figuring the Average NHL Standings Points per Team is “projected”, unlike prior seasons fully in the books. That is to say, if a team has 60 Standings Points in 60 games so far, they will be treated as though they are an 82-Standings Points team as that is their current mathematical projection. 


   Once again we see Cam Talbot has faced overall-lower competition (avg 88.9 standings points per opponent) than King Henrik (avg 94.668 standings points per opponent). 

   In both seasons, the Ludas Rating has reduced Talbot’s impressive numbers to a more realistic amount, as he has not been facing quality competition. Yet it is worth reminding: Talbot, an undrafted net minder who played college hockey at University of Alabama-Huntsville, who stumbled into the NHL following an abrupt mid-season retirement from Martin Biron in 2013… has undeniably played above-average in his time in New York.

   Are we expecting Talbot to play as good, or better than, Lundqvist? Probably not. Are we expecting Talbot to play above-average in the NHL? Of course. These studies show that, while his sharp career numbers are impressive, a little zip comes off the fastball when we hold Talbot accountable for playing sub-average teams for the most part. Overall, it’s hard to truly feel Cam Talbot is not performing satisfactorily... just not as well as Lundqvist.

* Please note: The data required to calculate a goaltender's Ludas Rating is very obnoxious and tedious. We are working on an algorithm to run smooth tabulations of various goaltenders' Ludas Rating, as to expand upon the metric, and provide more relative insight into goaltending leaguewide and in seasons past. We will post new data as it comes in, we ask you to be patient as this is a new equation, and currently takes a long time to configure. We look forward to your feedback!